FOM Dashboard
The Module Analysis Dashboard gives a quantitative, at-a-glance view of a model — its size, structure, semantics, and quality — so you can assess an object model without reading every table. It opens as the Dashboard tab of a module's Object Model Editor, and a Composed / Module Only toggle lets you analyze the merged composition or just the selected module.
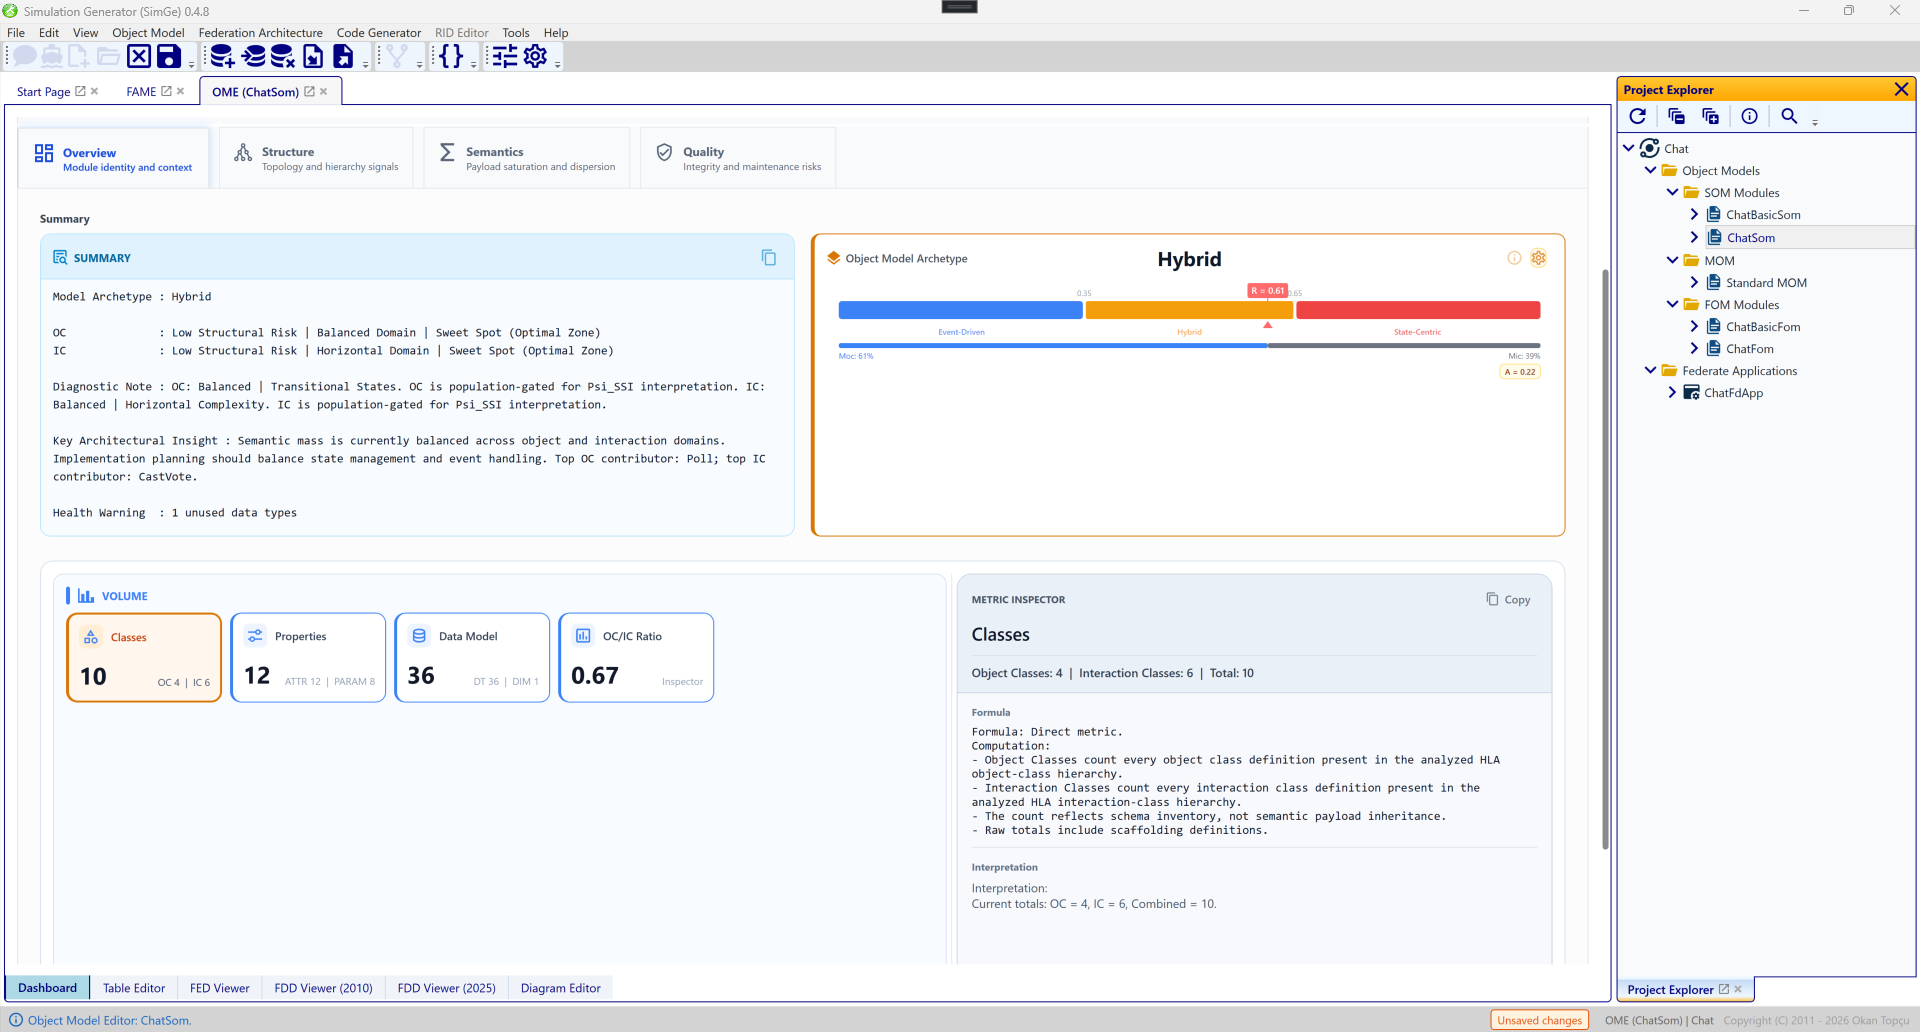
The dashboard's Overview tab. It reports the object-model archetype (here "Hybrid"), a written summary of the model, and headline metric cards — class count, property count, datatype count, and the OC/IC ratio — alongside an Object Model Archetype gauge.
The dashboard tabs
The dashboard is organized into four tabs:
| Tab | Shows |
|---|---|
| Overview | Module identity and context — archetype, summary, and the headline counts (classes, properties, datatypes, OC/IC ratio). |
| Structure | Topology and hierarchy signals — max depth and breadth, class complexity, and architectural metrics (e.g. WHL, S_top, CV_D) — with an Architecture Shape matrix and a Structure Heat Map. |
| Semantics | Payload saturation and dispersion — the Semantic Saturation Index (SSI_n) and coefficient of variation (CV_p) for each domain — with a saturation gauge. |
| Quality | Integrity and maintenance risks — diagnostic findings and warnings. |
Most figures are computed separately for the Object Class (OC) and Interaction Class (IC) domains, and a single analysis engine is the source of truth, so the dashboard numbers stay consistent with the reports.
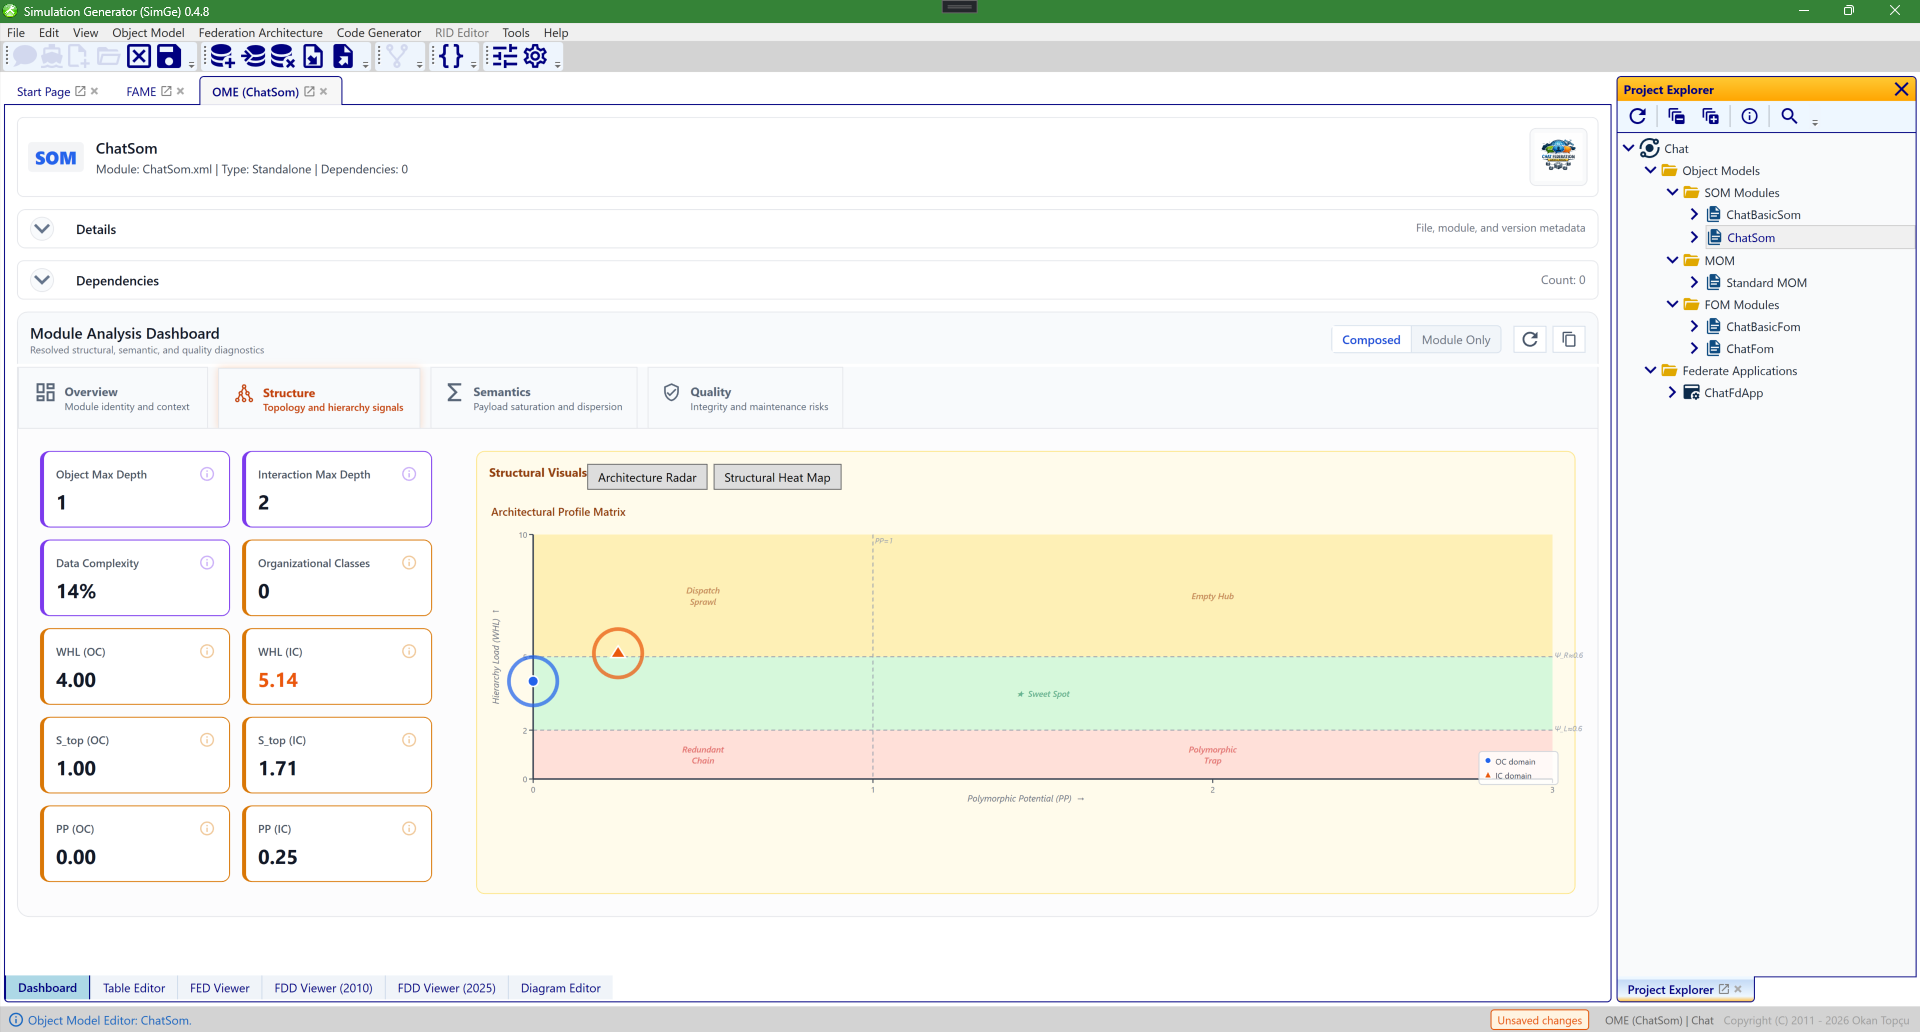
The Structure tab. It surfaces topology and hierarchy signals — object max depth and breadth, class complexity, and architectural metrics such as WHL(OC), S_top, and CV_D — and visualizes the model's "structured shape" via an Architecture Profile Matrix (with an alternate Structure Heat Map view).
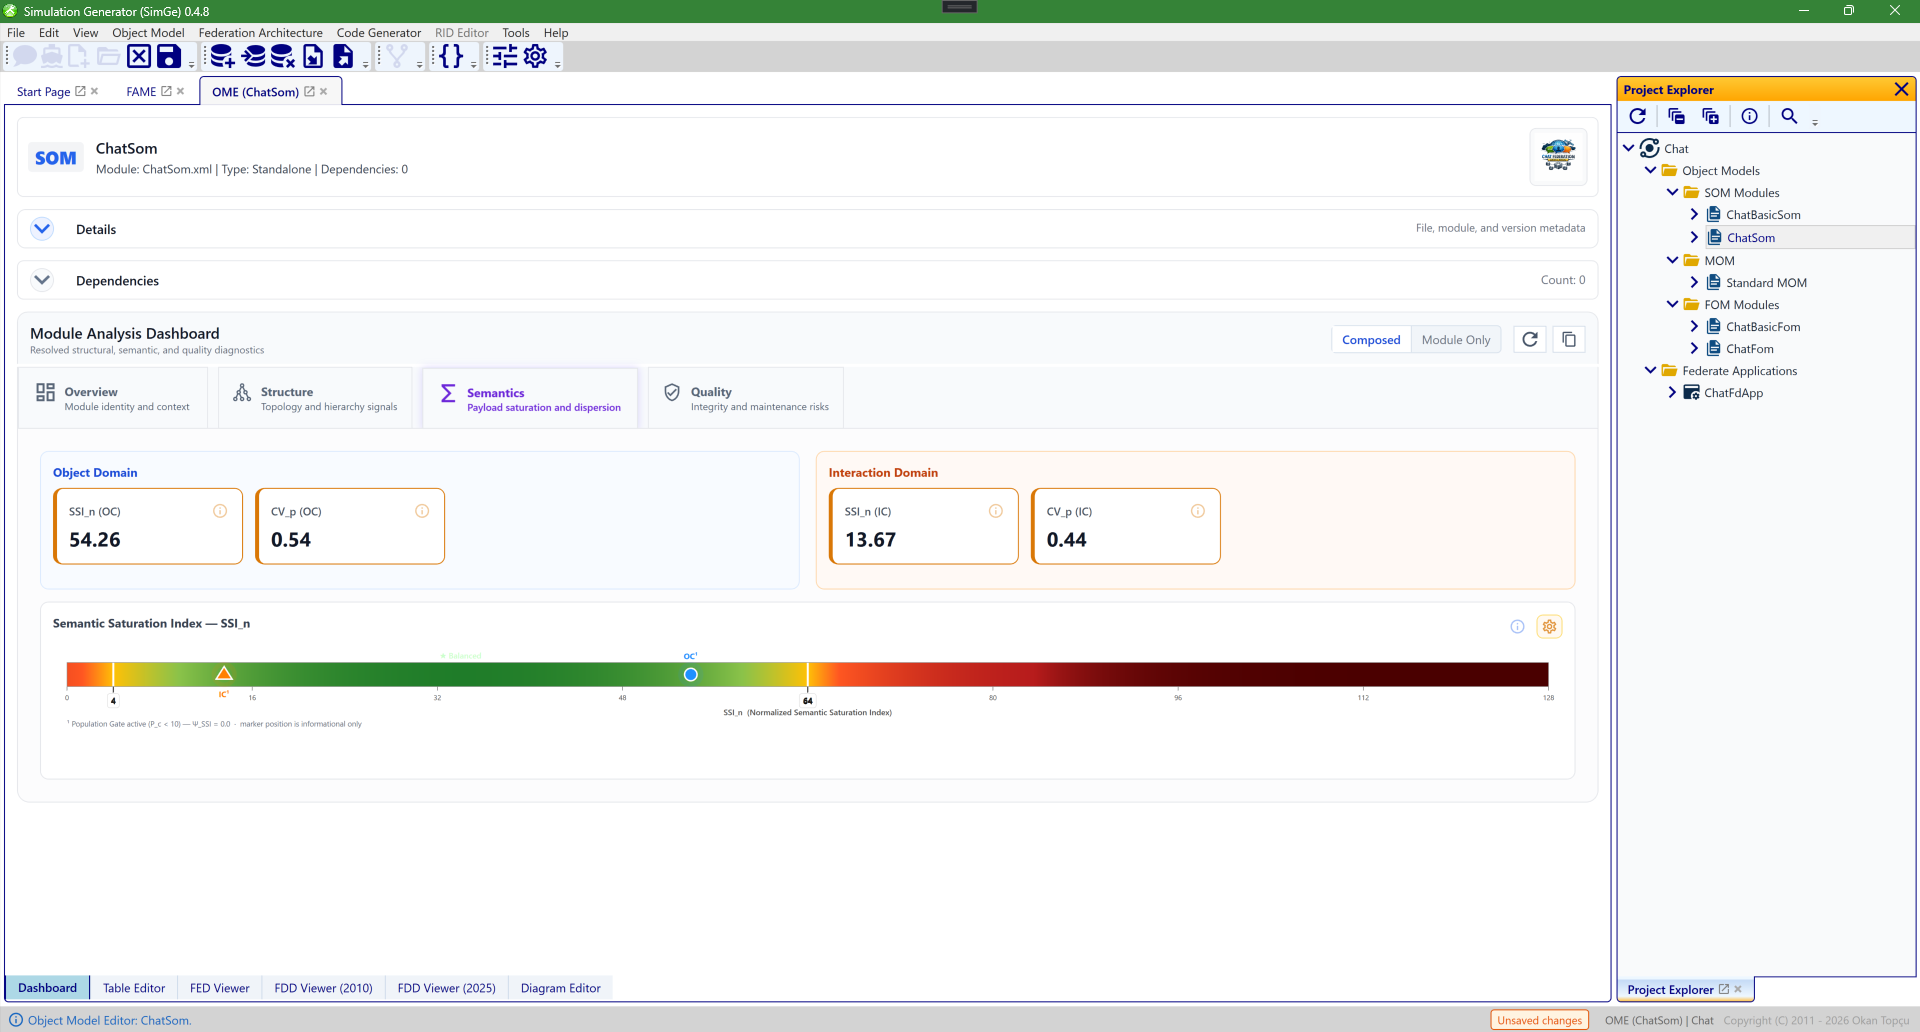
The Semantics tab. It characterizes payload saturation and dispersion rather than raw counts: the Semantic Saturation Index SSI_n and dispersion CV_p are shown for both the Object and Interaction domains, with a Semantic Saturation Index gauge. These signals feed metric-driven code generation.
Toolbar actions
The dashboard toolbar lets you refresh the analysis, copy the summary or the full textual report to the clipboard, and toggle between Composed and Module Only scope.
How to read it
- Start on Overview to grasp the model's archetype and scale.
- Check Quality for anything flagged — resolve unresolved dependencies and structural issues first (see Managing Modules and FOM Validation).
- Use Structure and Semantics to judge whether the model's shape and payload profile match your intent.
- Refresh after edits to see the effect.
Use the Composed scope to analyze the merged result that will actually be exported; use Module Only to focus on the selected module's own content.
Next: Model Metrics & Reports